The final step is to plot the orthomosaic raster(rgb) reflectance against the seedling status. A notebook file is included in the class folder for doing this. Copy the notebook to the ArcGIS project folder, double click the file from ArcGIS PRO and run all cells. The final figure should be a boxplot of reflectance value against seedling status (alive or dead).
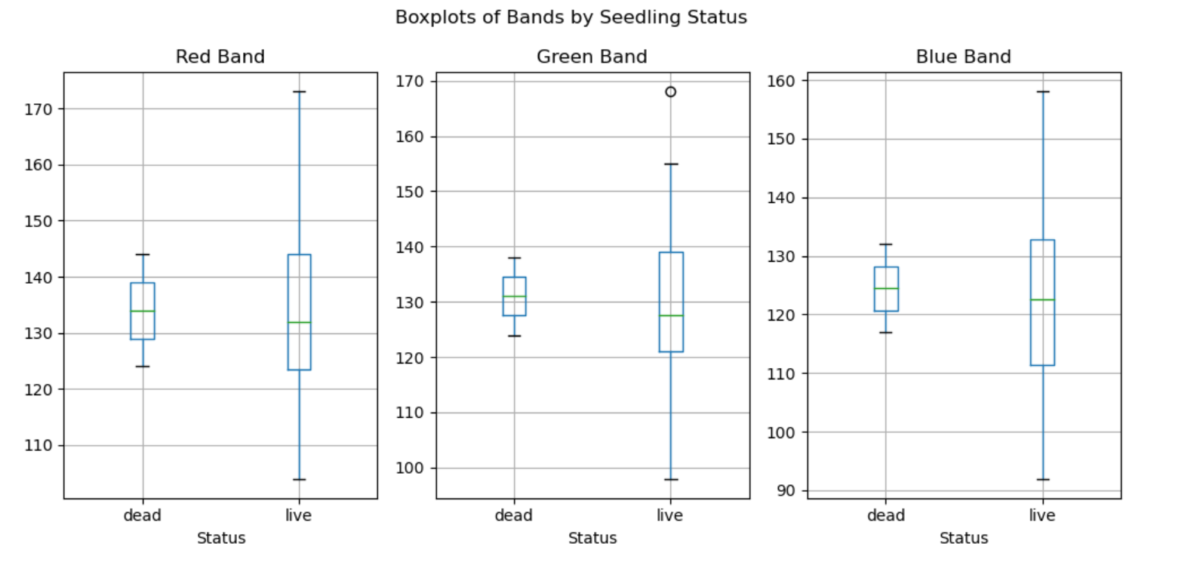
The boxplot provided a comprehensive representation of the variations in reflectance among different groups, shedding light on the potential relationships between seedling status and spectral characteristics. The mean reflectance values for dead seedlings is consistently higher than live seedlings across the red, green, and blue bands. However, distinguishing between dead and live plants solely based on RGB reflectance might be challenging due to significant reflectance variation within the live seedling group. Further advancements may be necessary, such as the inclusion of hyperspectral sensors or the utilization of a multispectral sensor capable of capturing data in the infrared region. By incorporating these enhancements, spectral indices can be calculated, offering deeper insights into the potential for identifying seedling survival and treatment types from UAV data.