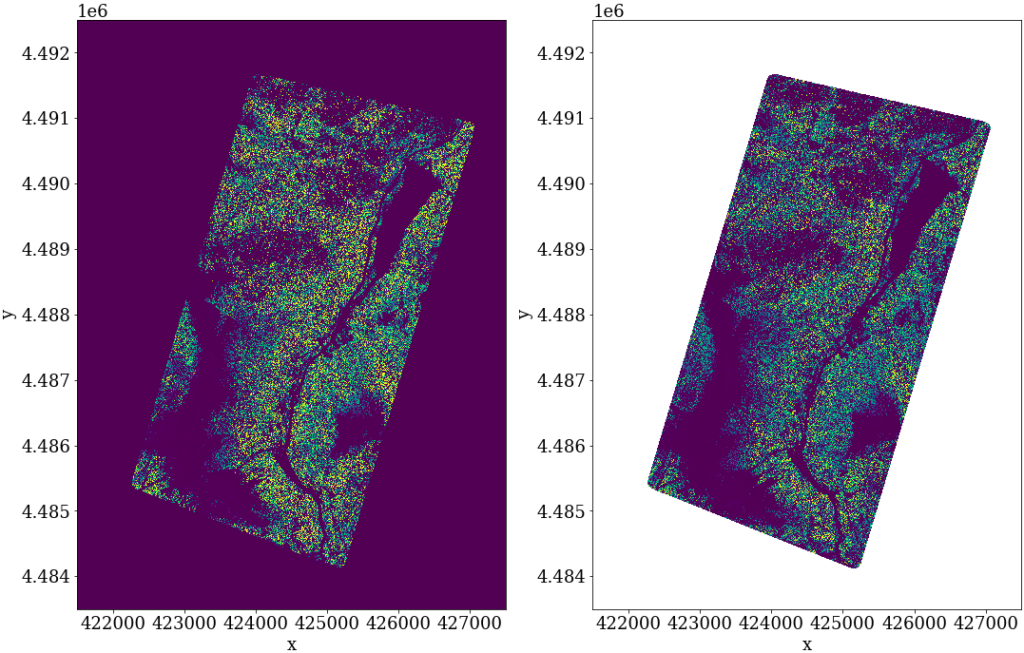
In this notebook, I demonstrated the importance of masking the no data value for raster calculation and plotting. I used a digital surface model and digital elevation model derived from lidar data which we acquired in 2020 over Cameron Pass study site for snow research.
To begin with, let’s import the necessary packages.
#import packages

import numpy as np
import rioxarray
import rasterio
from rasterio.merge import merge
from rasterio.plot import show
import glob
import os
import hvplot.xarray
import matplotlib.pyplot as plt
#read the DSM and DEM raster files
DSM = rioxarray.open_rasterio('/home/naheemadebisi/snow-analytics/lidar/results/Cameron/Cameron_DSMs_mosaic.tif')
DEM = rioxarray.open_rasterio('/home/naheemadebisi/snow-analytics/lidar/results/Cameron/Cameron_Bare_Earth_DEMs_mosaic.tif')

#let's look at one of the data
DEM
<xarray.DataArray (band: 1, y: 18000, x: 12000)>
[216000000 values with dtype=float32]
Coordinates:
  * band         (band) int64 1
  * x            (x) float64 4.215e+05 4.215e+05 ... 4.275e+05 4.275e+05
  * y            (y) float64 4.492e+06 4.492e+06 ... 4.484e+06 4.484e+06
    spatial_ref  int64 0
Attributes:
    _FillValue:    -3.4028234663852886e+38
    scale_factor:  1.0
    add_offset:    0.0
- band: 1
- y: 18000
- x: 12000
-
…
[216000000 values with dtype=float32]
-
-
band(band)int641
array([1])
-
x(x)float644.215e+05 4.215e+05 … 4.275e+05
array([421500.25, 421500.75, 421501.25, ..., 427498.75, 427499.25, 427499.75])
-
y(y)float644.492e+06 4.492e+06 … 4.484e+06
array([4492499.75, 4492499.25, 4492498.75, ..., 4483501.25, 4483500.75, 4483500.25]) -
spatial_ref()int640
- crs_wkt :
- PROJCS[“unnamed”,GEOGCS[“Unknown datum based upon the GRS 1980 ellipsoid”,DATUM[“Not_specified_based_on_GRS_1980_ellipsoid”,SPHEROID[“GRS 1980”,6378137,298.257222101004,AUTHORITY[“EPSG”,”7019″]],AUTHORITY[“EPSG”,”6019″]],PRIMEM[“Greenwich”,0],UNIT[“degree”,0.0174532925199433,AUTHORITY[“EPSG”,”9122″]],AUTHORITY[“EPSG”,”4019″]],PROJECTION[“Transverse_Mercator”],PARAMETER[“latitude_of_origin”,0],PARAMETER[“central_meridian”,-105],PARAMETER[“scale_factor”,0.9996],PARAMETER[“false_easting”,500000],PARAMETER[“false_northing”,0],UNIT[“metre”,1,AUTHORITY[“EPSG”,”9001″]],AXIS[“Easting”,EAST],AXIS[“Northing”,NORTH]]
- semi_major_axis :
- 6378137.0
- semi_minor_axis :
- 6356752.314140356
- inverse_flattening :
- 298.257222101004
- reference_ellipsoid_name :
- GRS 1980
- longitude_of_prime_meridian :
- 0.0
- prime_meridian_name :
- Greenwich
- geographic_crs_name :
- Unknown datum based upon the GRS 1980 ellipsoid
- horizontal_datum_name :
- Not specified (based on GRS 1980 ellipsoid)
- projected_crs_name :
- unnamed
- grid_mapping_name :
- transverse_mercator
- latitude_of_projection_origin :
- 0.0
- longitude_of_central_meridian :
- -105.0
- false_easting :
- 500000.0
- false_northing :
- 0.0
- scale_factor_at_central_meridian :
- 0.9996
- spatial_ref :
- PROJCS[“unnamed”,GEOGCS[“Unknown datum based upon the GRS 1980 ellipsoid”,DATUM[“Not_specified_based_on_GRS_1980_ellipsoid”,SPHEROID[“GRS 1980”,6378137,298.257222101004,AUTHORITY[“EPSG”,”7019″]],AUTHORITY[“EPSG”,”6019″]],PRIMEM[“Greenwich”,0],UNIT[“degree”,0.0174532925199433,AUTHORITY[“EPSG”,”9122″]],AUTHORITY[“EPSG”,”4019″]],PROJECTION[“Transverse_Mercator”],PARAMETER[“latitude_of_origin”,0],PARAMETER[“central_meridian”,-105],PARAMETER[“scale_factor”,0.9996],PARAMETER[“false_easting”,500000],PARAMETER[“false_northing”,0],UNIT[“metre”,1,AUTHORITY[“EPSG”,”9001″]],AXIS[“Easting”,EAST],AXIS[“Northing”,NORTH]]
- GeoTransform :
- 421500.0 0.5 0.0 4492500.0 0.0 -0.5
array(0)
-
-
- _FillValue :
- -3.4028234663852886e+38
- scale_factor :
- 1.0
- add_offset :
- 0.0
From the DataArray table, the fill value is -3.4028234663852886e+38. This is the no data value for the raster resulting from the boundary extent issue of the data. The problem with setting the no data value to -3.4028234663852886e+38 is that it will be considered in our raster calculation and plotting. We will see what this means to our analysis later.
Since we are analysing elevation data, -3.4028234663852886e+38 is an illogical to have. Let’s confirm that this value is included in the raster by looking at the values at the edge of the raster file using the subset method below.
DEM[0:100, 0:100].values
array([[[-3.4028235e+38, -3.4028235e+38, -3.4028235e+38, ...,
         -3.4028235e+38, -3.4028235e+38, -3.4028235e+38],
        [-3.4028235e+38, -3.4028235e+38, -3.4028235e+38, ...,
         -3.4028235e+38, -3.4028235e+38, -3.4028235e+38],
        [-3.4028235e+38, -3.4028235e+38, -3.4028235e+38, ...,
         -3.4028235e+38, -3.4028235e+38, -3.4028235e+38],
        ...,
        [-3.4028235e+38, -3.4028235e+38, -3.4028235e+38, ...,
         -3.4028235e+38, -3.4028235e+38, -3.4028235e+38],
        [-3.4028235e+38, -3.4028235e+38, -3.4028235e+38, ...,
         -3.4028235e+38, -3.4028235e+38, -3.4028235e+38],
        [-3.4028235e+38, -3.4028235e+38, -3.4028235e+38, ...,
         -3.4028235e+38, -3.4028235e+38, -3.4028235e+38]]], dtype=float32)
Now let’s read the file again but masking the no data value.
#read the DSM and DEM raster files
DSM_masked = rioxarray.open_rasterio('/home/naheemadebisi/snow-analytics/lidar/results/Cameron/Cameron_DSMs_mosaic.tif', masked = True)
DEM_masked = rioxarray.open_rasterio('/home/naheemadebisi/snow-analytics/lidar/results/Cameron/Cameron_Bare_Earth_DEMs_mosaic.tif', masked = True)

DEM_masked
<xarray.DataArray (band: 1, y: 18000, x: 12000)>
[216000000 values with dtype=float32]
Coordinates:
  * band         (band) int64 1
  * x            (x) float64 4.215e+05 4.215e+05 ... 4.275e+05 4.275e+05
  * y            (y) float64 4.492e+06 4.492e+06 ... 4.484e+06 4.484e+06
    spatial_ref  int64 0
Attributes:
    scale_factor:  1.0
    add_offset:    0.0
- band: 1
- y: 18000
- x: 12000
-
…
[216000000 values with dtype=float32]
-
-
band(band)int641
array([1])
-
x(x)float644.215e+05 4.215e+05 … 4.275e+05
array([421500.25, 421500.75, 421501.25, ..., 427498.75, 427499.25, 427499.75])
-
y(y)float644.492e+06 4.492e+06 … 4.484e+06
array([4492499.75, 4492499.25, 4492498.75, ..., 4483501.25, 4483500.75, 4483500.25]) -
spatial_ref()int640
- crs_wkt :
- PROJCS[“unnamed”,GEOGCS[“Unknown datum based upon the GRS 1980 ellipsoid”,DATUM[“Not_specified_based_on_GRS_1980_ellipsoid”,SPHEROID[“GRS 1980”,6378137,298.257222101004,AUTHORITY[“EPSG”,”7019″]],AUTHORITY[“EPSG”,”6019″]],PRIMEM[“Greenwich”,0],UNIT[“degree”,0.0174532925199433,AUTHORITY[“EPSG”,”9122″]],AUTHORITY[“EPSG”,”4019″]],PROJECTION[“Transverse_Mercator”],PARAMETER[“latitude_of_origin”,0],PARAMETER[“central_meridian”,-105],PARAMETER[“scale_factor”,0.9996],PARAMETER[“false_easting”,500000],PARAMETER[“false_northing”,0],UNIT[“metre”,1,AUTHORITY[“EPSG”,”9001″]],AXIS[“Easting”,EAST],AXIS[“Northing”,NORTH]]
- semi_major_axis :
- 6378137.0
- semi_minor_axis :
- 6356752.314140356
- inverse_flattening :
- 298.257222101004
- reference_ellipsoid_name :
- GRS 1980
- longitude_of_prime_meridian :
- 0.0
- prime_meridian_name :
- Greenwich
- geographic_crs_name :
- Unknown datum based upon the GRS 1980 ellipsoid
- horizontal_datum_name :
- Not specified (based on GRS 1980 ellipsoid)
- projected_crs_name :
- unnamed
- grid_mapping_name :
- transverse_mercator
- latitude_of_projection_origin :
- 0.0
- longitude_of_central_meridian :
- -105.0
- false_easting :
- 500000.0
- false_northing :
- 0.0
- scale_factor_at_central_meridian :
- 0.9996
- spatial_ref :
- PROJCS[“unnamed”,GEOGCS[“Unknown datum based upon the GRS 1980 ellipsoid”,DATUM[“Not_specified_based_on_GRS_1980_ellipsoid”,SPHEROID[“GRS 1980”,6378137,298.257222101004,AUTHORITY[“EPSG”,”7019″]],AUTHORITY[“EPSG”,”6019″]],PRIMEM[“Greenwich”,0],UNIT[“degree”,0.0174532925199433,AUTHORITY[“EPSG”,”9122″]],AUTHORITY[“EPSG”,”4019″]],PROJECTION[“Transverse_Mercator”],PARAMETER[“latitude_of_origin”,0],PARAMETER[“central_meridian”,-105],PARAMETER[“scale_factor”,0.9996],PARAMETER[“false_easting”,500000],PARAMETER[“false_northing”,0],UNIT[“metre”,1,AUTHORITY[“EPSG”,”9001″]],AXIS[“Easting”,EAST],AXIS[“Northing”,NORTH]]
- GeoTransform :
- 421500.0 0.5 0.0 4492500.0 0.0 -0.5
array(0)
-
-
- scale_factor :
- 1.0
- add_offset :
- 0.0
As we can see, there is no _Fillvalue again in the DataArray since we masked it out. In this case the no data value will be set to NaN. This is crucial as Nan won’t be considered in further raster calculation and plotting. Let’s confirm this by subsetting the corner region of the raster
DEM_masked[0:100, 0:100].values
array([[[nan, nan, nan, ..., nan, nan, nan],
        [nan, nan, nan, ..., nan, nan, nan],
        [nan, nan, nan, ..., nan, nan, nan],
        ...,
        [nan, nan, nan, ..., nan, nan, nan],
        [nan, nan, nan, ..., nan, nan, nan],
        [nan, nan, nan, ..., nan, nan, nan]]], dtype=float32)
Now let’s look at the impact of masking in raster calculation. We will calculate and compare the vegetation height for the masked and unmasked raster.
#Compute the vegetation height for unmasked data
VH = DSM - DEM
VH
<xarray.DataArray (band: 1, y: 18000, x: 12000)>
array([[[0., 0., 0., ..., 0., 0., 0.],
        [0., 0., 0., ..., 0., 0., 0.],
        [0., 0., 0., ..., 0., 0., 0.],
        ...,
        [0., 0., 0., ..., 0., 0., 0.],
        [0., 0., 0., ..., 0., 0., 0.],
        [0., 0., 0., ..., 0., 0., 0.]]], dtype=float32)
Coordinates:
  * band         (band) int64 1
  * x            (x) float64 4.215e+05 4.215e+05 ... 4.275e+05 4.275e+05
  * y            (y) float64 4.492e+06 4.492e+06 ... 4.484e+06 4.484e+06
    spatial_ref  int64 0
- band: 1
- y: 18000
- x: 12000
-
0.0 0.0 0.0 0.0 0.0 0.0 0.0 0.0 … 0.0 0.0 0.0 0.0 0.0 0.0 0.0 0.0
array([[[0., 0., 0., ..., 0., 0., 0.], [0., 0., 0., ..., 0., 0., 0.], [0., 0., 0., ..., 0., 0., 0.], ..., [0., 0., 0., ..., 0., 0., 0.], [0., 0., 0., ..., 0., 0., 0.], [0., 0., 0., ..., 0., 0., 0.]]], dtype=float32) -
-
band(band)int641
array([1])
-
x(x)float644.215e+05 4.215e+05 … 4.275e+05
array([421500.25, 421500.75, 421501.25, ..., 427498.75, 427499.25, 427499.75])
-
y(y)float644.492e+06 4.492e+06 … 4.484e+06
array([4492499.75, 4492499.25, 4492498.75, ..., 4483501.25, 4483500.75, 4483500.25]) -
spatial_ref()int640
- crs_wkt :
- PROJCS[“unnamed”,GEOGCS[“Unknown datum based upon the GRS 1980 ellipsoid”,DATUM[“Not_specified_based_on_GRS_1980_ellipsoid”,SPHEROID[“GRS 1980”,6378137,298.257222101004,AUTHORITY[“EPSG”,”7019″]],AUTHORITY[“EPSG”,”6019″]],PRIMEM[“Greenwich”,0],UNIT[“degree”,0.0174532925199433,AUTHORITY[“EPSG”,”9122″]],AUTHORITY[“EPSG”,”4019″]],PROJECTION[“Transverse_Mercator”],PARAMETER[“latitude_of_origin”,0],PARAMETER[“central_meridian”,-105],PARAMETER[“scale_factor”,0.9996],PARAMETER[“false_easting”,500000],PARAMETER[“false_northing”,0],UNIT[“metre”,1,AUTHORITY[“EPSG”,”9001″]],AXIS[“Easting”,EAST],AXIS[“Northing”,NORTH]]
- semi_major_axis :
- 6378137.0
- semi_minor_axis :
- 6356752.314140356
- inverse_flattening :
- 298.257222101004
- reference_ellipsoid_name :
- GRS 1980
- longitude_of_prime_meridian :
- 0.0
- prime_meridian_name :
- Greenwich
- geographic_crs_name :
- Unknown datum based upon the GRS 1980 ellipsoid
- horizontal_datum_name :
- Not specified (based on GRS 1980 ellipsoid)
- projected_crs_name :
- unnamed
- grid_mapping_name :
- transverse_mercator
- latitude_of_projection_origin :
- 0.0
- longitude_of_central_meridian :
- -105.0
- false_easting :
- 500000.0
- false_northing :
- 0.0
- scale_factor_at_central_meridian :
- 0.9996
- spatial_ref :
- PROJCS[“unnamed”,GEOGCS[“Unknown datum based upon the GRS 1980 ellipsoid”,DATUM[“Not_specified_based_on_GRS_1980_ellipsoid”,SPHEROID[“GRS 1980”,6378137,298.257222101004,AUTHORITY[“EPSG”,”7019″]],AUTHORITY[“EPSG”,”6019″]],PRIMEM[“Greenwich”,0],UNIT[“degree”,0.0174532925199433,AUTHORITY[“EPSG”,”9122″]],AUTHORITY[“EPSG”,”4019″]],PROJECTION[“Transverse_Mercator”],PARAMETER[“latitude_of_origin”,0],PARAMETER[“central_meridian”,-105],PARAMETER[“scale_factor”,0.9996],PARAMETER[“false_easting”,500000],PARAMETER[“false_northing”,0],UNIT[“metre”,1,AUTHORITY[“EPSG”,”9001″]],AXIS[“Easting”,EAST],AXIS[“Northing”,NORTH]]
- GeoTransform :
- 421500.0 0.5 0.0 4492500.0 0.0 -0.5
array(0)
-
#Compute the vegetation height for masked data
VH_mask = DSM_masked - DEM_masked
VH_mask
<xarray.DataArray (band: 1, y: 18000, x: 12000)>
array([[[nan, nan, nan, ..., nan, nan, nan],
        [nan, nan, nan, ..., nan, nan, nan],
        [nan, nan, nan, ..., nan, nan, nan],
        ...,
        [nan, nan, nan, ..., nan, nan, nan],
        [nan, nan, nan, ..., nan, nan, nan],
        [nan, nan, nan, ..., nan, nan, nan]]], dtype=float32)
Coordinates:
  * band         (band) int64 1
  * x            (x) float64 4.215e+05 4.215e+05 ... 4.275e+05 4.275e+05
  * y            (y) float64 4.492e+06 4.492e+06 ... 4.484e+06 4.484e+06
    spatial_ref  int64 0
- band: 1
- y: 18000
- x: 12000
-
nan nan nan nan nan nan nan nan … nan nan nan nan nan nan nan nan
array([[[nan, nan, nan, ..., nan, nan, nan], [nan, nan, nan, ..., nan, nan, nan], [nan, nan, nan, ..., nan, nan, nan], ..., [nan, nan, nan, ..., nan, nan, nan], [nan, nan, nan, ..., nan, nan, nan], [nan, nan, nan, ..., nan, nan, nan]]], dtype=float32) -
-
band(band)int641
array([1])
-
x(x)float644.215e+05 4.215e+05 … 4.275e+05
array([421500.25, 421500.75, 421501.25, ..., 427498.75, 427499.25, 427499.75])
-
y(y)float644.492e+06 4.492e+06 … 4.484e+06
array([4492499.75, 4492499.25, 4492498.75, ..., 4483501.25, 4483500.75, 4483500.25]) -
spatial_ref()int640
- crs_wkt :
- PROJCS[“unnamed”,GEOGCS[“Unknown datum based upon the GRS 1980 ellipsoid”,DATUM[“Not_specified_based_on_GRS_1980_ellipsoid”,SPHEROID[“GRS 1980”,6378137,298.257222101004,AUTHORITY[“EPSG”,”7019″]],AUTHORITY[“EPSG”,”6019″]],PRIMEM[“Greenwich”,0],UNIT[“degree”,0.0174532925199433,AUTHORITY[“EPSG”,”9122″]],AUTHORITY[“EPSG”,”4019″]],PROJECTION[“Transverse_Mercator”],PARAMETER[“latitude_of_origin”,0],PARAMETER[“central_meridian”,-105],PARAMETER[“scale_factor”,0.9996],PARAMETER[“false_easting”,500000],PARAMETER[“false_northing”,0],UNIT[“metre”,1,AUTHORITY[“EPSG”,”9001″]],AXIS[“Easting”,EAST],AXIS[“Northing”,NORTH]]
- semi_major_axis :
- 6378137.0
- semi_minor_axis :
- 6356752.314140356
- inverse_flattening :
- 298.257222101004
- reference_ellipsoid_name :
- GRS 1980
- longitude_of_prime_meridian :
- 0.0
- prime_meridian_name :
- Greenwich
- geographic_crs_name :
- Unknown datum based upon the GRS 1980 ellipsoid
- horizontal_datum_name :
- Not specified (based on GRS 1980 ellipsoid)
- projected_crs_name :
- unnamed
- grid_mapping_name :
- transverse_mercator
- latitude_of_projection_origin :
- 0.0
- longitude_of_central_meridian :
- -105.0
- false_easting :
- 500000.0
- false_northing :
- 0.0
- scale_factor_at_central_meridian :
- 0.9996
- spatial_ref :
- PROJCS[“unnamed”,GEOGCS[“Unknown datum based upon the GRS 1980 ellipsoid”,DATUM[“Not_specified_based_on_GRS_1980_ellipsoid”,SPHEROID[“GRS 1980”,6378137,298.257222101004,AUTHORITY[“EPSG”,”7019″]],AUTHORITY[“EPSG”,”6019″]],PRIMEM[“Greenwich”,0],UNIT[“degree”,0.0174532925199433,AUTHORITY[“EPSG”,”9122″]],AUTHORITY[“EPSG”,”4019″]],PROJECTION[“Transverse_Mercator”],PARAMETER[“latitude_of_origin”,0],PARAMETER[“central_meridian”,-105],PARAMETER[“scale_factor”,0.9996],PARAMETER[“false_easting”,500000],PARAMETER[“false_northing”,0],UNIT[“metre”,1,AUTHORITY[“EPSG”,”9001″]],AXIS[“Easting”,EAST],AXIS[“Northing”,NORTH]]
- GeoTransform :
- 421500.0 0.5 0.0 4492500.0 0.0 -0.5
array(0)
-
From the dataArray table above, notice the difference between raster calculation using masked and unmasked raster. For the unmasked, the _Fillvalue is (-3.4028234663852886e+38) is included in the calculation and since they are the same for both DSM and DEM, we got zeros in these regions for our vegetation height. If the impact of this is yet to be evident, wait till we plot the data. But for the masked data, the no data value is set to Nan and not included in the calculation. So we get nan in the resulting vegetation height in this region. Let’s create a function to plot the two vegetion height rasters
def plot_veg_height(raster1, raster2):
    # Set font size and font family of matplotlib for plotting
    plt.rcParams.update({'font.size': 18})
    plt.rcParams['font.family'] = 'serif'
    plt.rcParams['font.serif'] = ['Times New Roman'] + plt.rcParams['font.serif']

    #create a figure and axes elements
    fig, ax = plt.subplots(figsize=(15,11), constrained_layout=True, ncols=2)

    #plot lidar differenced DEMs
    raster1.plot(ax=ax[0], cmap = 'viridis', robust = True, cbar_kwargs={'label': 'Vegetation height (unmasked)', 'orientation': 'horizontal'})
    ax[0].set_title('')
    raster2.plot(ax=ax[1], cmap = 'viridis', robust = True, cbar_kwargs={'label': 'Vegetation height (masked)', 'orientation': 'horizontal'})
    ax[1].set_title('')


    plt.show()
plot_veg_height(VH, VH_mask)
As we see, the masked raster plot is more presentable than the unmasked vegetation whose zero edge region values are included in the plot.


