Rioxarray is a python package that is built upon xarray and rasterio packages to facilitate the analysis of raster or xarray datasest. In this article, I show an example of how I read and visualize raster data using rioxarray. This is demonstrated using UAVSAR data, an airborne full polarization L-band SAR data.
The first thing as usual is to import the necessary packages.
import rasterio as rio
import rioxarray as rxr
import numpy as np
import matplotlib.pyplot as plt
import earthpy as et
import os
import glob
Here, I set the path directory for the data.
#set path
print('working directory:', os.getcwd()) #print current working directory
#print(et.io.HOME) #print home directory

#set the absolute path for the data
data_path = '/SNOWDATA/Nah/lowman/tiffs/'
print('data directory:', data_path)
working directory: /home/naheemadebisi/snow-analytics/lowman
data directory: /SNOWDATA/Nah/lowman/tiffs/
There are multiple files in my data directory, so I used glob to select all the coherence data for a particular acquisition.
# get list of all files in the data folder
coherence_quadpol = glob.glob(data_path+'*05208_21009-005_21012-004_0007d_s01_L090*_01.cor*.tiff')
coherence_quadpol
The return of glob is a list of all coherence at four polarizations:
['/SNOWDATA/Nah/lowman/tiffs/lowman_05208_21009-005_21012-004_0007d_s01_L090HH_01.cor.grd.tiff',
 '/SNOWDATA/Nah/lowman/tiffs/lowman_05208_21009-005_21012-004_0007d_s01_L090HV_01.cor.grd.tiff',
 '/SNOWDATA/Nah/lowman/tiffs/lowman_05208_21009-005_21012-004_0007d_s01_L090VH_01.cor.grd.tiff',
 '/SNOWDATA/Nah/lowman/tiffs/lowman_05208_21009-005_21012-004_0007d_s01_L090VV_01.cor.grd.tiff']
Here, I used the open_rasterio() method of the rioxarray data to read each of the coherence and stored them in a list.
#Read the coherence of the quadpol data
coherence = []
for i in coherence_quadpol:
    array = rxr.open_rasterio(i)
    coherence.append(array)
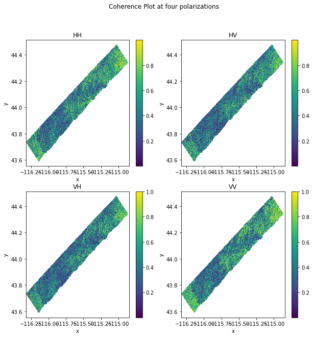
Here, I plotted each of the coherence using matplotloib
#Plot the coherence for each of the four polarizations (HH, HV, VH, VV)
fig, axs = plt.subplots(nrows=2, ncols=2, figsize=(10, 10))

coherence[0].plot(ax=axs[0, 0], cmap='viridis')
axs[0, 0].set_title('HH')

coherence[1].plot(ax=axs[0, 1], cmap='viridis')
axs[0, 1].set_title('HV')

coherence[2].plot(ax=axs[1, 0], cmap='viridis')
axs[1, 0].set_title('VH')

coherence[3].plot(ax=axs[1, 1], cmap='viridis')
axs[1, 1].set_title('VV')

fig.suptitle('Coherence Plot at four polarizations')

plt.show()


